Service F · continued
Optimizing building performance
17
Building performance model
Inputs
Architecture
Envelope
HVAC
Lighting
Daylight
Renewables
Occupancy
Climate data
→
Energy
simulation
simulation
Outputs
Optimized building performance
Annual energy consumption · Energy Use Intensity · peak demand · end-use breakdown · compliance margin · certification points · carbon and cost inputs.
Energy conservation measures we evaluate
| Envelope | Insulation levels, thermal bridging, air-tightness, glazing specification, window-to-wall ratio, external shading and orientation response. |
| HVAC | System selection, plant efficiency, part-load behaviour, heat recovery, demand-controlled ventilation, chilled water and district cooling interface. |
| Lighting | Installed power density, daylight-linked dimming, occupancy control and zoning strategy. |
| Controls | Setpoints, schedules, optimum start, night purge, and the gap between designed and operated behaviour. |
| Renewables | Photovoltaic array sizing, self-consumption, solar thermal and on-site generation scenarios. |
Deliverables
- Energy model & report
- Baseline / proposed comparison
- ECM evaluation matrix
- Code compliance documentation
- Certification energy submission
- EUI and consumption forecast
−32%
Indicative energy reduction, optimized case
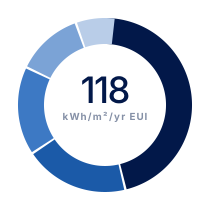
118
kWh/m²/yr modelled EUI
8760
Hours simulated per annual run